Arista Networks vs. IBM: Comparing Quarterly Revenue Trends Between These Artificial Intelligence Giants
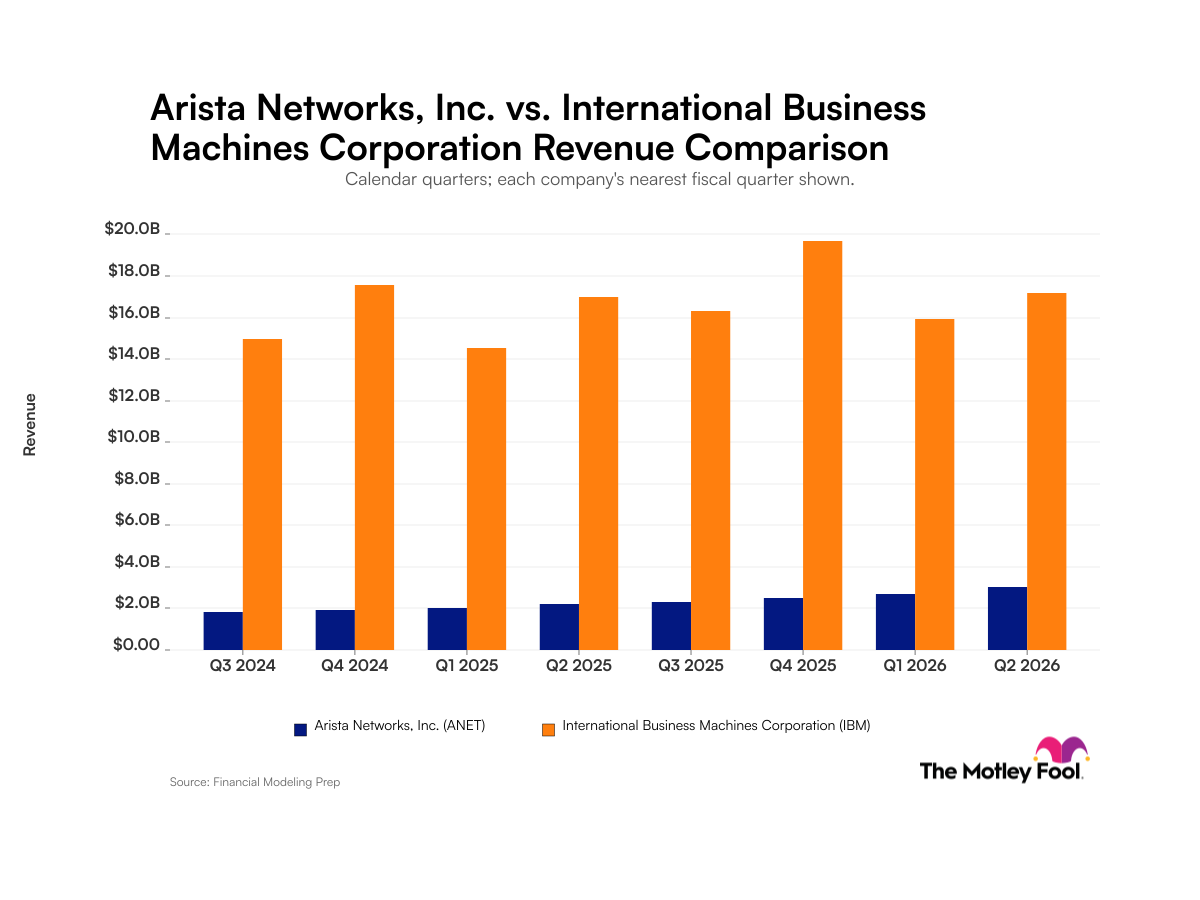
Arista has posted eight straight quarters of revenue gains, while IBM swings between peaks and valleys.
Arista Networks: Steady and Reliable Quarterly Revenue Expansion
Arista Networks (NYSE:ANET) primarily generates its operating income by designing advanced cloud networking solutions, delivering specialized high-performance switching hardware, and providing extensive post-contract technical support to major internet companies and global financial services organizations.
While launching new hardware platforms for data centers and simultaneously expanding its enterprise security portfolio during the summer of 2026, it reported a 45% operating margin for the quarter ended June 30, 2026.
International Business Machines: Highly Volatile and Cyclical Revenue Patterns
International Business Machines (NYSE:IBM) earns a majority of its incoming cash by supplying complex hybrid cloud software ecosystems, developing enterprise server infrastructure, and delivering specialized business transformation consulting services to clients across the globe.
It faced multiple securities fraud investigations regarding its public business deal outlook and completed the acquisition of HRL Laboratories in the summer of 2026 to advance its work in quantum computing . It generated a 15% operating margin for the quarter ended June 30, 2026.
Why Tracking Revenue Matters for Investors
Revenue assists everyday investors understand whether a business is successfully attracting new clients and expanding its broader operational footprint. It serves as a starting point to help investors understand the total amount of money a business brings in before deducting any operational expenses.
Comparing Quarterly Revenue for Arista Networks and International Business Machines
$1.8 billion (quarter ended Sept. 30, 2024)
$15.0 billion (quarter ended Sept. 30, 2024)
$1.9 billion (quarter ended Dec. 31, 2024)
$17.6 billion (quarter ended Dec. 31, 2024)
$2.0 billion (quarter ended March 31, 2025)
$14.5 billion (quarter ended March 31, 2025)
$2.2 billion (quarter ended June 30, 2025)
$17.0 billion (quarter ended June 30, 2025)
$2.3 billion (quarter ended Sept. 30, 2025)
$16.3 billion (quarter ended Sept. 30, 2025)
$2.5 billion (quarter ended Dec. 31, 2025)
$19.7 billion (quarter ended Dec. 31, 2025)
$2.7 billion (quarter ended March 31, 2026)
$15.9 billion (quarter ended March 31, 2026)
$3.0 billion (quarter ended June 30, 2026)
$17.2 billion (quarter ended June 30, 2026)
Data source: Company filings. Data as of Sept. 4, 2026.
Topics in this story
Gathered from external sources. Rights to this text belong to whoever originally published it.