In midterm years, October is usually the best month for stocks, with gains 73.7% of the time
Since 1950, September has been the weakest month of a midterm year, and October and November the strongest. Strategists say the setup, so far, still holds.
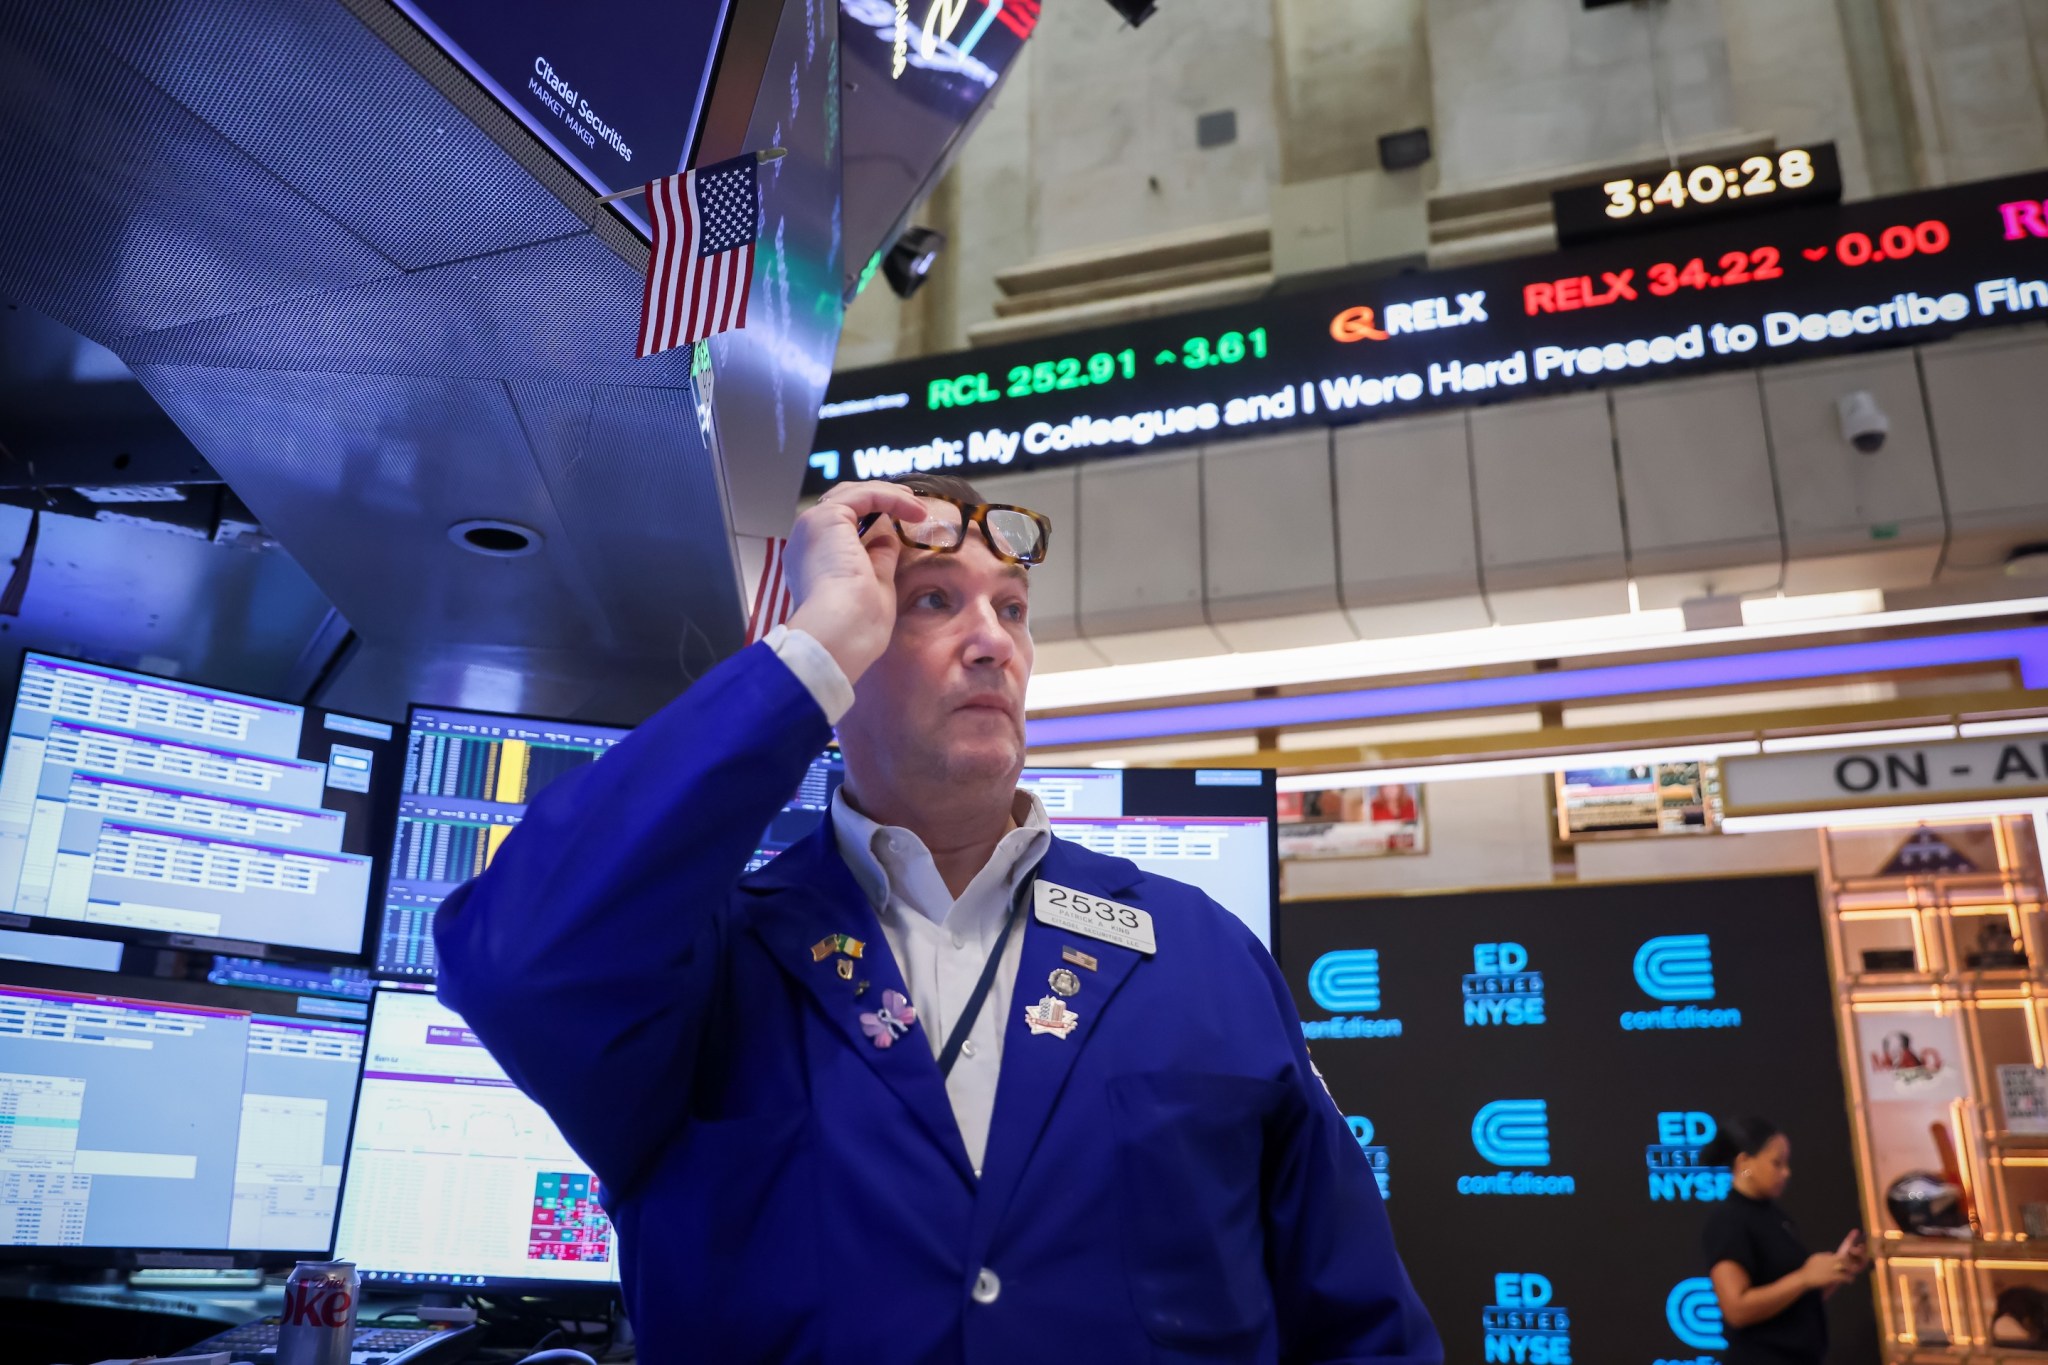
If you're a believer in stock market patterns, good news: History shows that in midterm election years, October is the best month of the year for stock performance, followed closely by November.
Carson Group chief market strategist Ryan Detrick points to the seasonal pattern. In a chart posted on X on Sept. 20, Detrick showed that, since 1950, October has been the best-performing month of the year in U.S. midterm years, averaging a 3% gain for the S&P 500 and posting positive returns 73.7% of the time.
November ranks second, averaging a 2.7% gain, with positive returns 78.9% of the time. "Almost there," he wrote, a nod to the fact that markets are just exiting what his data shows is the weakest month of the cycle: September, which has averaged a 0.8% decline.
The pattern also lines up with research from some of Wall Street's biggest firms.
A recent report from UBS Global Research examined previous midterm elections since 1950, which is 19 in total, to assess their potential impact on equities and equity volatility. During midterm election years, S&P 500 returns have averaged about 6% from September through year-end, compared with about 4% in other years. Through March, the average return has been approximately 14%, according to the report.
Returns were negative only in 1978, amid inflation; 2002, during the bursting of the tech bubble; and 2018, amid the trade war and the Federal Reserve's rate hikes.
"The market has typically been choppy from August-end until early October, with a median decline of -1.4%, before the market starts to rally through year-end and into the next year," UBS strategist Maxwell Grinacoff wrote in a research note. The rally in U.S. equities around midterm elections has historically outpaced the market's average performance in other years, according to Grinacoff.
Equity volatility follows a similar pattern. September and October have historically been the most volatile months on record since 1928, particularly during midterm election years. Volatility, however, has ultimately normalized after the elections and into year-end, he explained.
J.P. Morgan Asset Management finds that the S&P 500 has historically been slightly negative on average in each of the first three quarters of midterm years, before averaging a 6.6% gain in the fourth quarter. It also notes that markets have historically begun rallying less than a month before Election Day.
This year's setup adds tension to that historical pattern. The S&P 500 was up approximately 13% year to date on a total return basis as of September 18, putting 2026 on track for a fourth consecutive year of gains.
Topics in this story
Gathered from external sources. Rights to this text belong to whoever originally published it.