The Most Important Win In The World Series May Surprise You
An analysis of 31 years of World Series data reveals which games matter most, how victories affect championship odds, and what mathematics says about winning...
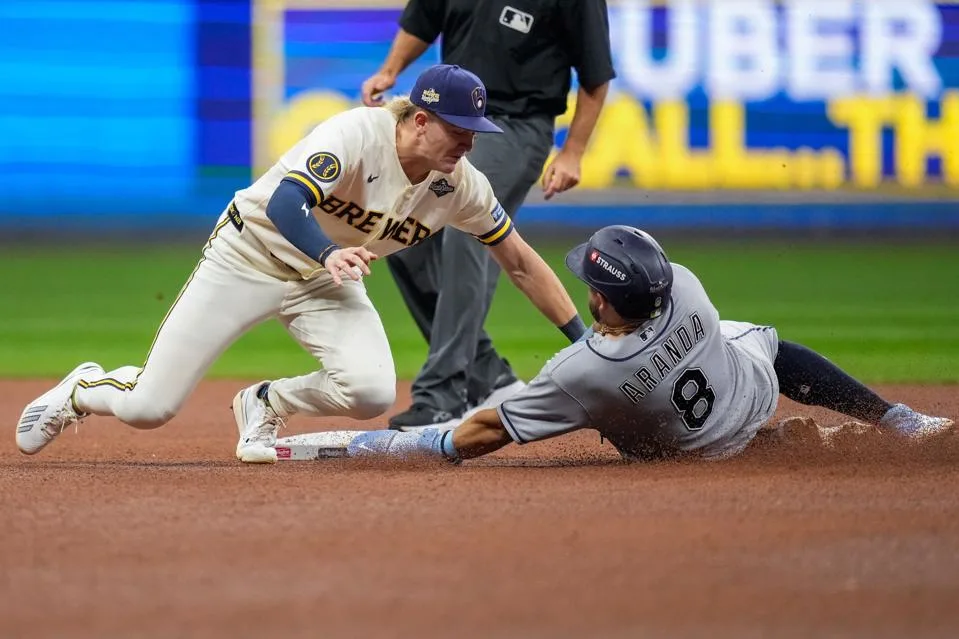
The 2026 World Series was already historic before the first pitch. For the first time since 1980, two franchises that have never won a championship will compete. The Milwaukee Brewers and Tampa Bay Rays, representing two of Major League Baseball's smaller markets and operating with relatively modest payrolls , have overcome some of the sport's wealthiest competitors to reach baseball's biggest stage. Regardless of the outcome, one franchise will celebrate its first World Series title.
For both teams, the stakes could hardly be higher. Every victory brings a franchise closer to a championship that has eluded it throughout its history. Yet the significance of individual World Series victories is rarely considered equal.
Yet the relative importance of these victories is less obvious than it might seem. Is winning Game 1 particularly consequential? Does Game 3 represent a critical turning point? Or does the importance of a victory increase as the series approaches its conclusion? Which World Series win matters most?
To investigate, I analyzed 175 games from the 31 World Series played between 1995 and 2025, using historical records compiled by Retrosheet . I examined how frequently the winner of each game ultimately became champion, how those probabilities varied with the series score, and how the historical outcomes compared with the mathematical probabilities of a best-of-seven series between evenly matched teams.
The analysis reveals several intriguing patterns, including differences between historical championship rates and the probabilities implied by the structure of the series itself. Understanding those differences requires examining what it actually means for one World Series victory to matter more than another.
World Series Game 1 Has Been a Strong Historical Indicator of Championship Success
The analysis begins in 1995, the inaugural season of Major League Baseball's Wild Card Era . Between 1995 and 2025, the team that won Game 1 went on to win the World Series in 24 of 31 instances, representing a championship rate of 77.4%. That was the highest observed rate among winners of the first five games.
Game 2 winners became champions 64.5% of the time, compared with 61.3% for Game 3 winners. The corresponding rates for Games 4 and 5 were 67.7% and 68.0%. The historical rates increased for the final two games. Game 6 winners became champions in 82.4% of the series that reached a sixth game, while every Game 7 winner necessarily became champion.
The Game 1 result is particularly noteworthy. Winning the opener has historically been associated with a substantially higher championship rate than winning Game 3, despite both games occurring in every World Series. (The Brewers clinched Game 1 Friday night.) The historical association does not establish that winning Game 1 produces a greater increase in championship probability than winning another game. Stronger teams may be more likely to win both the opener and the championship, while individual World Series outcomes remain subject to considerable randomness. A mathematical comparison helps distinguish the significance of a victory from its observed association with the eventual championship.
What Mathematics Says About Winning World Series Game 1
Consider a World Series between two evenly matched teams, each with an independent 50% probability of winning any individual game. Under these assumptions, both teams begin with a 50% chance of winning the championship. After winning Game 1, a team's championship probability rises to 65.625%. After losing, it falls to 34.375%. Winning the opener therefore increases championship probability by 15.625 percentage points relative to the pre-series position.
However, there is another way to measure the importance of Game 1: compare the championship probabilities associated with its two possible outcomes. Winning produces a 65.625% championship probability, while losing produces a 34.375% probability. The difference is 31.25 percentage points. This difference is the game's championship-probability swing. The measure captures how much the result matters when comparing a victory with a defeat from the same starting position. It can be calculated for every possible series score and provides a consistent framework for evaluating the mathematical stakes of individual games.
The observed historical rate of 77.4% exceeds that benchmark by approximately 11.8 percentage points. Yet the historical sample includes teams of different strengths, and the difference is compatible with sampling uncertainty. More importantly, the theoretical Game 1 probability provides a baseline for examining whether other World Series victories can have greater mathematical consequences.
Why the Series Score Matters More In World Series Game 3
Game 3 provides a particularly revealing example because its importance depends on the results of the preceding two games. If the World Series is tied 1–1 entering Game 3, the winner takes a 2–1 lead.
Under the evenly matched model, that team has a 68.75% probability of winning the championship. The losing team, now trailing 1–2, has a 31.25% championship probability. The difference is 37.5 percentage points, exceeding the 31.25-point swing associated with Game 1. Consequently, a Game 3 victory in a tied series has greater mathematical consequences than a Game 1 victory.
The calculation changes when a team enters Game 3 already leading 2–0. A victory gives that team a commanding 3–0 advantage and a 93.75% probability of becoming champion. A defeat leaves it leading 2–1, with a championship probability of 68.75% representing a difference of 25 percentage points. The same 25-point swing applies to a team entering Game 3 trailing 0–2. Winning improves its championship probability to 31.25%, while losing reduces it to 6.25%. These findings reveal why the probability of winning the championship after a Game 3 victory cannot be fully understood without considering the preceding results.
The historical data provide an additional perspective. Among the 16 World Series that entered Game 3 tied 1–1, the Game 3 winner eventually became champion 11 times. The observed rate of 68.75% matches the theoretical probability exactly. Although notable, that agreement should not be interpreted as evidence that the model perfectly describes postseason baseball. With only 16 observations, the historical estimate has considerable uncertainty.
The experience of teams entering Game 3 with a two-game deficit is similarly revealing. Of the eight teams that won Game 3 after falling behind 0–2, only one ultimately won the championship. The practical meaning of a victory therefore depends heavily on the team's position when the game begins.
Importantly, there is a distinction between the probability of becoming champion after a victory and the magnitude of the probability swing. A team already leading 2–0 can have a very high championship probability after another victory, even though that victory produces a smaller probability swing than winning Game 3 in a tied series.
How the Mathematical Stakes Change in World Series Games 4 Through 7
The importance of a victory becomes increasingly dependent on the series score as the World Series progresses. Game 4 offers four possible starting positions. Under the evenly matched model, winning Game 4 when the series stands 2–1 or 1–2 produces a championship-probability swing of 37.5 percentage points. When the series stands 3–0 or 0–3, the swing is considerably smaller, at 12.5 percentage points.
Game 5 presents an even greater contrast. With the series tied 2–2, the winner moves ahead 3–2 and has a 75% probability of becoming champion. The loser, now trailing 2–3, has a championship probability of 25%. The resulting 50-percentage-point swing exceeds the corresponding value of any game in the first four contests. However, when Game 5 begins with one team leading 3–1, the probability swing is only 25 percentage points.
Game 6 has a different mathematical structure because it can occur only when the series stands 3–2. A victory by the leading team secures the championship, while a defeat forces Game 7. From either team's perspective, the difference between winning and losing Game 6 is 50 percentage points.
Finally, Game 7 offers the maximum possible probability swing of 100 percentage points. Its winner becomes champion, while its loser is eliminated.
These results demonstrate that the mathematical consequences of a World Series victory cannot be determined from the game number alone. The series score establishes how much championship probability is at stake, and the largest swings generally occur when the series remains closely contested.
The historical record offers a compelling case for the importance of winning Game 1. Since 1995, teams that won the World Series opener have gone on to capture 77.4% of championships, the highest rate among winners of the first five games. Yet the mathematical analysis reveals that the consequences of a victory depend heavily on the series score. A win in a closely contested series can produce a substantially greater change in championship probability than an identical result earlier in the competition.
Game 7 represents the ultimate example, with a single victory determining the championship. However, its relatively low probability of occurring introduces an important consideration. When the likelihood of reaching each game is incorporated into the analysis, all seven scheduled games have precisely the same expected championship-probability swing under the evenly matched model. This finding reconciles two seemingly contradictory observations: later games can carry considerably greater consequences, even as every potential game begins with the same expected mathematical importance.
For the Brewers and Rays, the distinction offers an intriguing perspective on a World Series that will produce a first-time champion. The historical record suggests that winning the opener is associated with considerable championship success. The mathematics, however, leaves room for the significance of each subsequent victory to change as the series unfolds.
Topics in this story
Gathered from external sources. Rights to this text belong to whoever originally published it.