In a 2021 Missouri I-270 work-zone trial, a speed trailer flashing red and blue lights produced an extra 2.8 mph speed reduction; 53.5% beyond the base setup
Discover how a recent Missouri study showed that speed trailers with red and blue lights significantly reduce speeds in work zones. Explore the findings on traffic safety and enforcement methods.
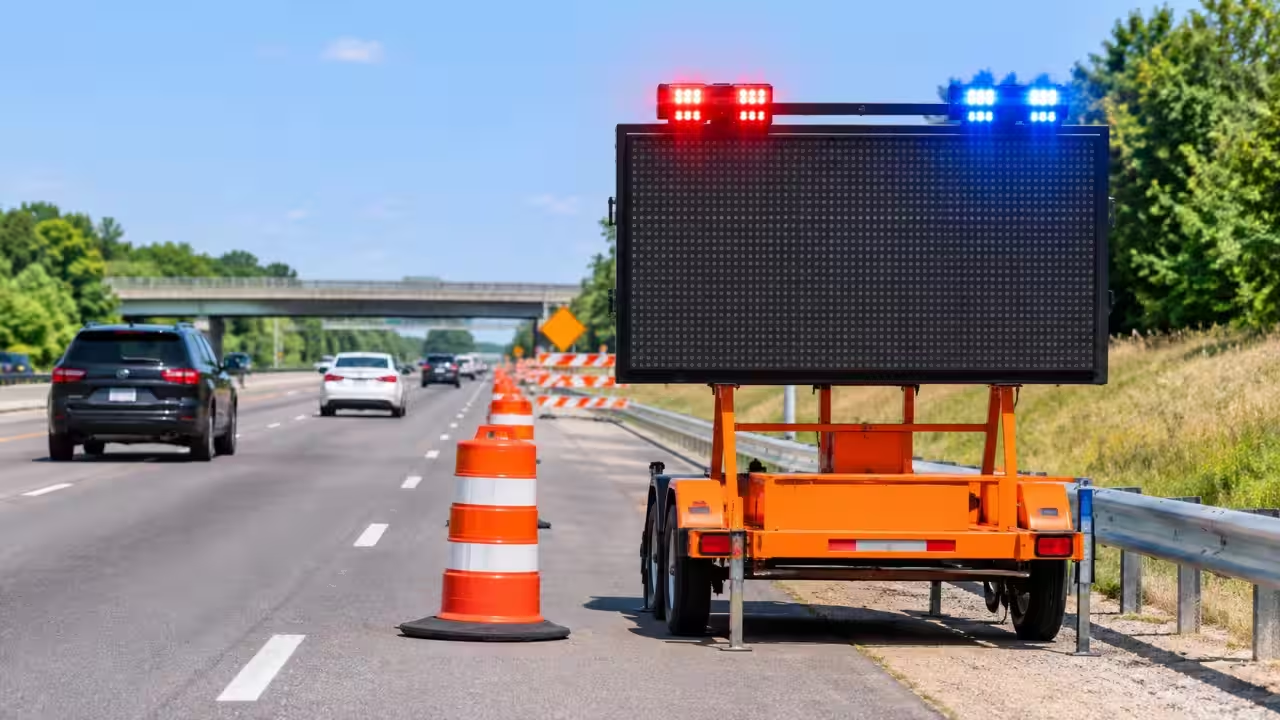
In August 2021, a stretch of westbound I-270 in St. Louis gave Missouri transportation officials a headache. Motorists were speeding through the work zone between the Lindbergh Boulevard interchange and Dunn Road, where traffic had to follow a lane shift of about 50 feet, the largest on the project and the Missouri Department of Transportation (MoDOT) wanted evidence on which roadside tools could slow vehicles down. MoDOT’s 2020 traffic figures, cited in the University of Missouri report, put I-270 at more than 140,000 vehicles a day, so even a small cut in speed mattered.University of Missouri researchers mounted radar sensors on either side of the work zone and collected data for about four weeks, from August 3 to August 26, while rotating through several speed countermeasures. They documented the trial in the report, Effectiveness of Speed Management Methods in Work Zones, published in October 2022. One of the tools was a speed display trailer that flashed red and blue lights at drivers going over the limit. During the daytime, it produced an additional speed reduction of 2.8 mph, a 53.5% further reduction compared with the base scenario, a result also listed in the US Department of Transportation’sITS Knowledge Resources database.The work zone alone cut daytime speeds by 5.2 mphThe above-mentioned study recorded a daytime drop in average speed from 64.5 mph at the upstream sensor to 59.3 mph at the downstream sensor with no countermeasure in place. This 5.2 mph decrease was attributed to the presence of a work zone and its lane change. Researchers used it as a base and considered only the decrease that would occur after the base value. In the case of the red and blue trailer, the speeds dropped from 64.1 mph to 56.1 mph, with a total reduction of 8.0 mph. The 2.8 mph reduction after deducting the base value represents a reduction of 53.5% of the base reduction. That 53.5% figure does not mean traffic speed fell by 53.5% overall.Active enforcement added 4.3 mph in the daytime, more than any other countermeasureThe same report showed that during the day, active law enforcement, where officers pulled violators over, added 4.3 mph of reduction compared with the base scenario, or 81.7%. Passive enforcement, a police car parked on the shoulder, added 2.4 mph (46.0%), so the red and blue trailer did better than the parked police car. The ordinary speed display trailer provided 0.5 mph (9.9%), whereas the trailer that had flashing speed digits contributed 1.3 mph (24.8%).Compliance and excessive speeding changed in the same direction. With the red and blue trailer, the share of drivers at or below the speed limit rose from 8.2% at the upstream sensor to 20.1% at the downstream sensor, compared with 4.7% and 9.4%, respectively, when no countermeasures were used. Excessive speeding drivers decreased from 70.2% to 38.8% in comparison with 73.2% to 52.7%, respectively, whereas 92.8% of all vehicles exceeded the limit.The trailer with red and blue lights ran for just nine hoursThat 2.8 mph result rests on a short run, because the red and blue trailer was in place for only nine hours of the roughly four weeks of field data collection. The report’s actual field schedule lists the trailer on August 23, 2021, from 8 a.m. to 5 p.m., after equipment problems limited its availability. During this period, there were still 28,615 cars passing upstream and 24,117 cars passing downstream, while the effect size of the trailer was 0.83 and considered large. At night, the field test was conducted using the vehicle equipped with flashing red and blue lights instead of the trailer. Because weather and equipment availability kept the trailer out of the field after dark, the nighttime version was tested only in a driving simulator.A 50-driver simulator showed a smaller daytime effectIn the daytime simulations, the red and blue trailer added only 0.4 mph, or 12.6%, which the researchers classed as a small effect. The speed profile seemed favourable for their trailer. At the trailer location, it had an average speed of 50.2 mph compared to 52.5 mph for the base scenario. However, the highest difference, 3.3 mph, was observed 250 feet downstream. The biggest gap with the base scenario, 3.3 mph, appeared 250 feet downstream. By 1,000 feet downstream, though, drivers passing the red and blue trailer were travelling faster than those passing the plain speed trailer. Response to the service suggested something different. The red and blue trailer was perceived to be more effective in reducing speed, but the drivers believed that they would reduce speed more due to police presence.Oregon night paving trials also tested flashing lightsFlashing lights were also tested outside Missouri. A separate study, Effects of Flashing Blue Lights Mounted on Paving Equipment on Vehicle Speed Behavior in Work Zones, appeared in the Journal of Construction Engineering and Management in 2021. Oregon researchers mounted flashing blue lights on paving equipment during nighttime work on three case study projects. At distances upstream of the paver where drivers could see and react to the lights, mean speeds were 4.3 to 25.7 km/h lower with the lights on than with them off. The speed differential, meaning the speed before the work zone minus the speed inside it, was also 4.8 to 11.3 km/h greater with the lights on. The Missouri researchers suggested that some work zones could add a second countermeasure 250 to 500 feet downstream from the first, to discourage drivers from speeding up again after passing it, as mentioned in the above study.You use AI every day. Now get your AI Quotient. Take the AIQ test.
Topics in this story
Gathered from external sources. Rights to this text belong to whoever originally published it.