We May Be Witnessing Wall Street's Biggest Bubble Burst in Real Time (and I'm Not Talking About Artificial Intelligence)
The stock market’s $1.5 trillion powder keg may be about to blow.
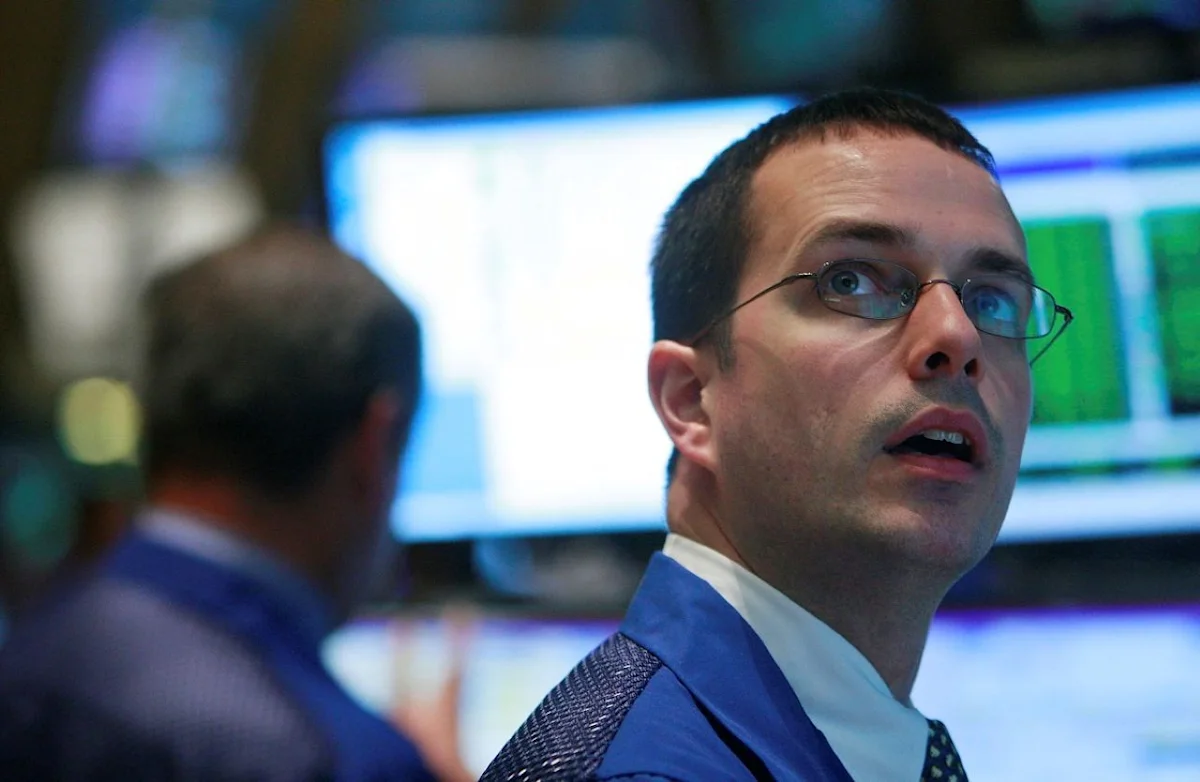
Since the 2022 bear market bottomed, it's been all systems go for the ageless Dow Jones Industrial Average (DJINDICES:^DJI), benchmark S&P 500 (SNPINDEX:^GSPC), and innovation-inspired Nasdaq Composite (NASDAQINDEX:^IXIC). Since reaching their respective troughs, the Dow has powered higher by up to 90%, while the S&P 500 and Nasdaq have more than doubled.
While the artificial intelligence (AI) infrastructure build-out has been the primary catalyst behind Wall Street's gains, it's not the only reason stocks are higher. Historically low peak marginal corporate income tax rates have fueled record share buyback activity by S&P 500 companies. Stock-split euphoria and record-breaking initial public offerings are also intriguing retail investors.
Missed AI's "Act 1"? Act 2 Could Be 16x Bigger. Most investors think they missed the AI boat because they didn't buy Nvidia in 2005. But according to our analysts, we're only at the end of "Act 1"—the R&D phase. "Act 2" is the global rollout. Continue »
While history has repeatedly shown that the Dow, S&P 500, and Nasdaq Composite rally over multiple decades, it also tells us that bull markets don't last forever. Eventually, something is going to knock Wall Street's AI-driven bull market off its pedestal -- and we may be watching that bubble burst before our very eyes right now .
While everyone's focused on the potential formation and subsequent bursting of an AI bubble, there's a $1.5 trillion bubble that looks to be bursting in real time.
The stock market's risk-taking bubble appears ready to implode
Even though past events can't concretely predict the future, history has a way of rhyming on Wall Street. In other words, historical precedent often sets the tone.
Over the last three decades, few, if any, past events, metrics, or indicators have accurately forecast the future quite like outstanding margin debt.
Margin represents the money an investor borrows, with interest, from their broker to short-sell (wager against) or purchase securities, such as stocks or exchange-traded funds (ETFs). When used to buy stocks or ETFs, margin acts as leverage -- and leverage can be risky.
On the one hand, if a stock or ETF moves in the desired direction, margin can help an investor amplify their gains. But if the security in question moves in the opposite direction, it can quickly magnify losses, on top of owing the broker interest on what's borrowed. This dynamic is what makes outstanding margin debt a crude but incredibly useful risk-measuring metric.
Topics in this story
Gathered from external sources. Rights to this text belong to whoever originally published it.