What Happens When Strong Uptrends Meet Bullish Sentiment?
Uptrending stocks with optimism from analysts tend to outperform over the next month
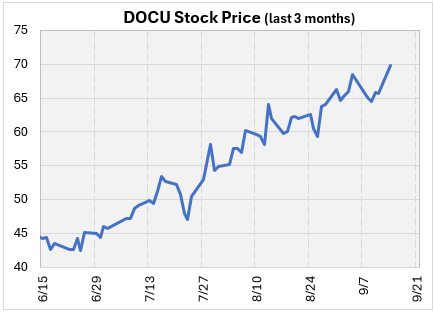
Is there anything prettier than a consistently uptrending stock price chart? I'm drawn to these types of charts. I've always thought a consistent uptrend is an indication of strong buying power for a stock. However, while I can tell you if a chart looks like a consistent, methodical trend, it's hard to define it using data, which is necessary to create an indicator. That's why, until now, I've never put numbers behind my theory.
I won't go into the details, but using moving averages over various time frames, I've created a ranking system for stocks with the most consistent uptrends and downtrends over the past three months. Using this ranking system, Docusign (DOCU) is one of the top uptrending stocks. That's a pretty chart, if I do say so myself. When I see a chart like this, I think, why would it stop now?
In this week's article, I'll test my theory with actual numbers and see if DOCU and other stocks like it are good bets, like my instincts have always led me to believe.
My Trend Indicator and Next-Month Returns
For this study, I went back to 2024 and picked the 18th of each month, which corresponds to the end of this week. I used my trend ranking system to find the 30 stocks in the strongest uptrends and the 30 in the most consistent downtrends. Then, I tracked how each group performed over the next month of trading. The table below summarizes the results.
My instincts look correct based on the average returns of the stocks. The top uptrending stocks averaged a return of 2.15% over the next month, while the most consistently downtrending stocks averaged a return of 1.57%. The other stocks averaged 1.84%, falling between the two groups.
However, I'm a bit disappointed that the uptrending stocks were no more likely to be positive or beat the S&P 500 Index (SPX) than other stocks. Instead, the edge came from the size of the winners. The positive trades among the uptrending stocks averaged about 12%, while those among other stocks averaged closer to 11%. In other words, the top-trending stocks did not necessarily win more often; they tended to win bigger when they did.
I added a layer of sentiment to strengthen the indicator. My contrarian mind expected uptrending stocks where pessimism was prominent to outperform other stocks. My thinking was that more pessimism meant more pent-up buying power that could propel the stock higher. When I look at the numbers, however, brokerage analysts tend to be correct on these stocks.
To measure sentiment, I gathered brokerage recommendation data from Zacks Research. I separated the uptrending stocks from my study into three groups based on the percentage of analysts who rated the stocks a "buy." Stocks for which at least 80% of analysts had a "buy" rating averaged a return of 2.61%. Stocks that analysts were most bearish on averaged a return of 1.72%. The stocks analysts were bullish on also had the highest percentage of positive returns, at 57%. And even though the percentage beating the SPX was just 50%, that was better than the other groups.
Topics in this story
Gathered from external sources. Rights to this text belong to whoever originally published it.