Self Storage Data Shows Independents Leading Recovery
Self storage data shows independent operators leading rate and occupancy gains as debt maturities create a large small-deal pipeline.
This story was originally published on CRE Daily . Join 70,000+ commercial real estate professionals getting daily news, market insights, and industry analysis delivered straight to their inbox with the free CRE Daily newsletter .
Independent operators manage 65.7% of tracked self storage facilities, but only 46.2% of SF because their properties are far smaller than REIT-run stores.
Independent street rates rose 6.5% year over year versus 4.7% for REITs, while the occupancy rebound was concentrated in non-REIT properties.
TractIQ tracks 1,508 self storage loans totaling $28.48B maturing through 2028, including 731 independent-operator loans averaging just $2.6M.
TractIQ's August market briefing argues that most US self storage facilities operate outside the public REIT universe . Its database tracks 68,019 operating facilities and 2.77B SF. Independent operators manage 43,939 properties, or 65.7% of the total, while REITs manage 16.3%. Because independent facilities are smaller, those operators control 46.2% of tracked SF compared with 29.4% for REITs.
The Industry Changes Outside Major Markets
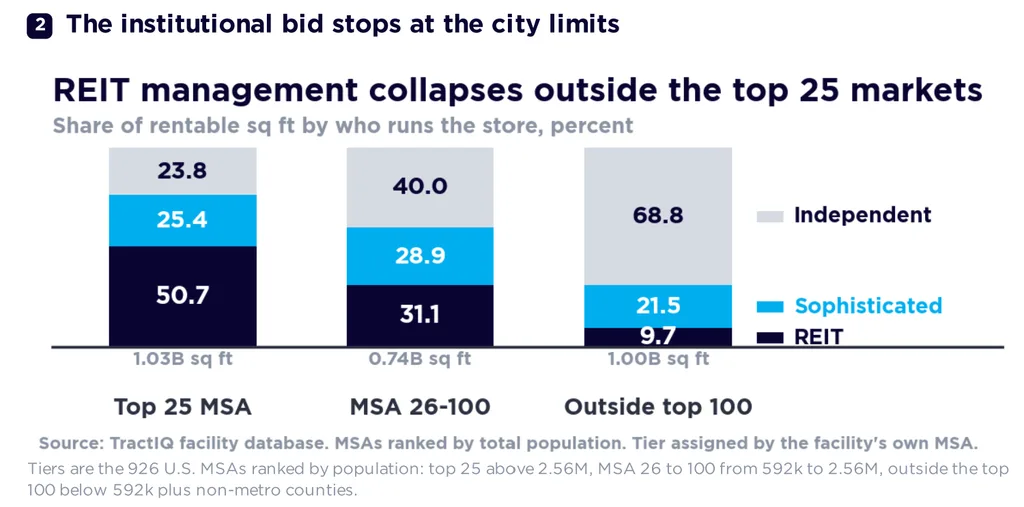
The size gap is substantial. The median independently managed facility is 17,150 SF, compared with 64,905 SF for a REIT-run store. REIT brands manage 50.7% of self storage SF in the top 25 metropolitan areas. Their share falls to 9.7% outside the top 100 markets.
Outside those top 100 metros, 536 of 826 markets have no REIT-managed SF at all. Those smaller markets still contain about 1.00B SF of inventory. That is nearly equal to the 1.03B SF inside the top 25 metros. TractIQ's data therefore describes a large operating universe that public-company reporting captures only partially.
Independent operators posted the strongest year-over-year street-rate growth in July. Rates rose 6.5% to $1.078 PSF per month, versus a 4.7% increase for REITs and 1.6% for sophisticated non-REIT operators. REIT street rates remained 41% above independent rates in August, but the premium narrowed to 12% on web pricing.
Online discounting explains much of that difference. TractIQ found 98.8% of REIT-run stores offered web rates at least 2% below street pricing, compared with 18% of independents. REIT web pricing of $1.130 PSF was almost identical to the $1.133 PSF level among sophisticated operators.
Occupancy showed a similar split. In a same-store CMBS pool, REIT occupancy slipped 10 basis points to 89.4% between March 2025 and March 2026. Sophisticated operators gained 810 basis points to 83.2%, while independents improved 130 basis points to 86.5%.
Topics in this story
Gathered from external sources. Rights to this text belong to whoever originally published it.